Developers and marketing teams working on A/B testing in Webflow often find themselves asking if the variations are genuinely meaningful or just a stroke of luck? The answer to this question relies on the significance of A/B statistics. Let's learn about statistical analysis in A/B testing and its role in promising reliable results to web testers.

In A/B testing, statistical significance verifies whether differences in outcomes are meaningful or simply a result of chance. It ensures reliable decisions based on data. Without it, conclusions may be flawed, leading to incorrect actions. This is why it is an essential step in A/B testing in Webflow.
With A/B testing statistics, we can tell if the implemented changes make sense. It helps us draw valid conclusions from A/B test results because it is based on statistical evidence.

Statistical significance measures the reliability and validity of the test results. Probability plays an integral part here as it helps quantify the likelihood of obtaining the observed results, assuming there's no real difference between the versions.
A low probability value (typically below a predetermined threshold, like 0.05) indicates that the observed differences are unlikely to occur by chance alone, suggesting statistical significance.
Statistical significance is vital in A/B testing, a quality check to distinguish real differences from chance and short-term data fluctuations.
It filters out random noise, ensuring changes based on A/B testing in Webflow yield genuine improvements. Thus, A/B testing statistics are incredibly significant as they ensure evidence-based decisions, enhancing outcomes.
Testers and web developers understand the importance of confidence in what they see and decipher from tests. Here's how to do that:
Calculating and checking statistical significance in A/B testing involves different ways to make sure that any differences we see between versions (A and B) are real and not just by chance. Here's how it's done:
Identifying A/B testing misinterpretations and mistakes is vital to maintaining accurate results. Here’s how you can avoid them:
Ensuring the statistical significance of A/B testing in Webflow is crucial for reliable conclusions. Here's how:
Now that we have covered the significance of A/B testing statistics, it's time to look at A/B testing platforms.
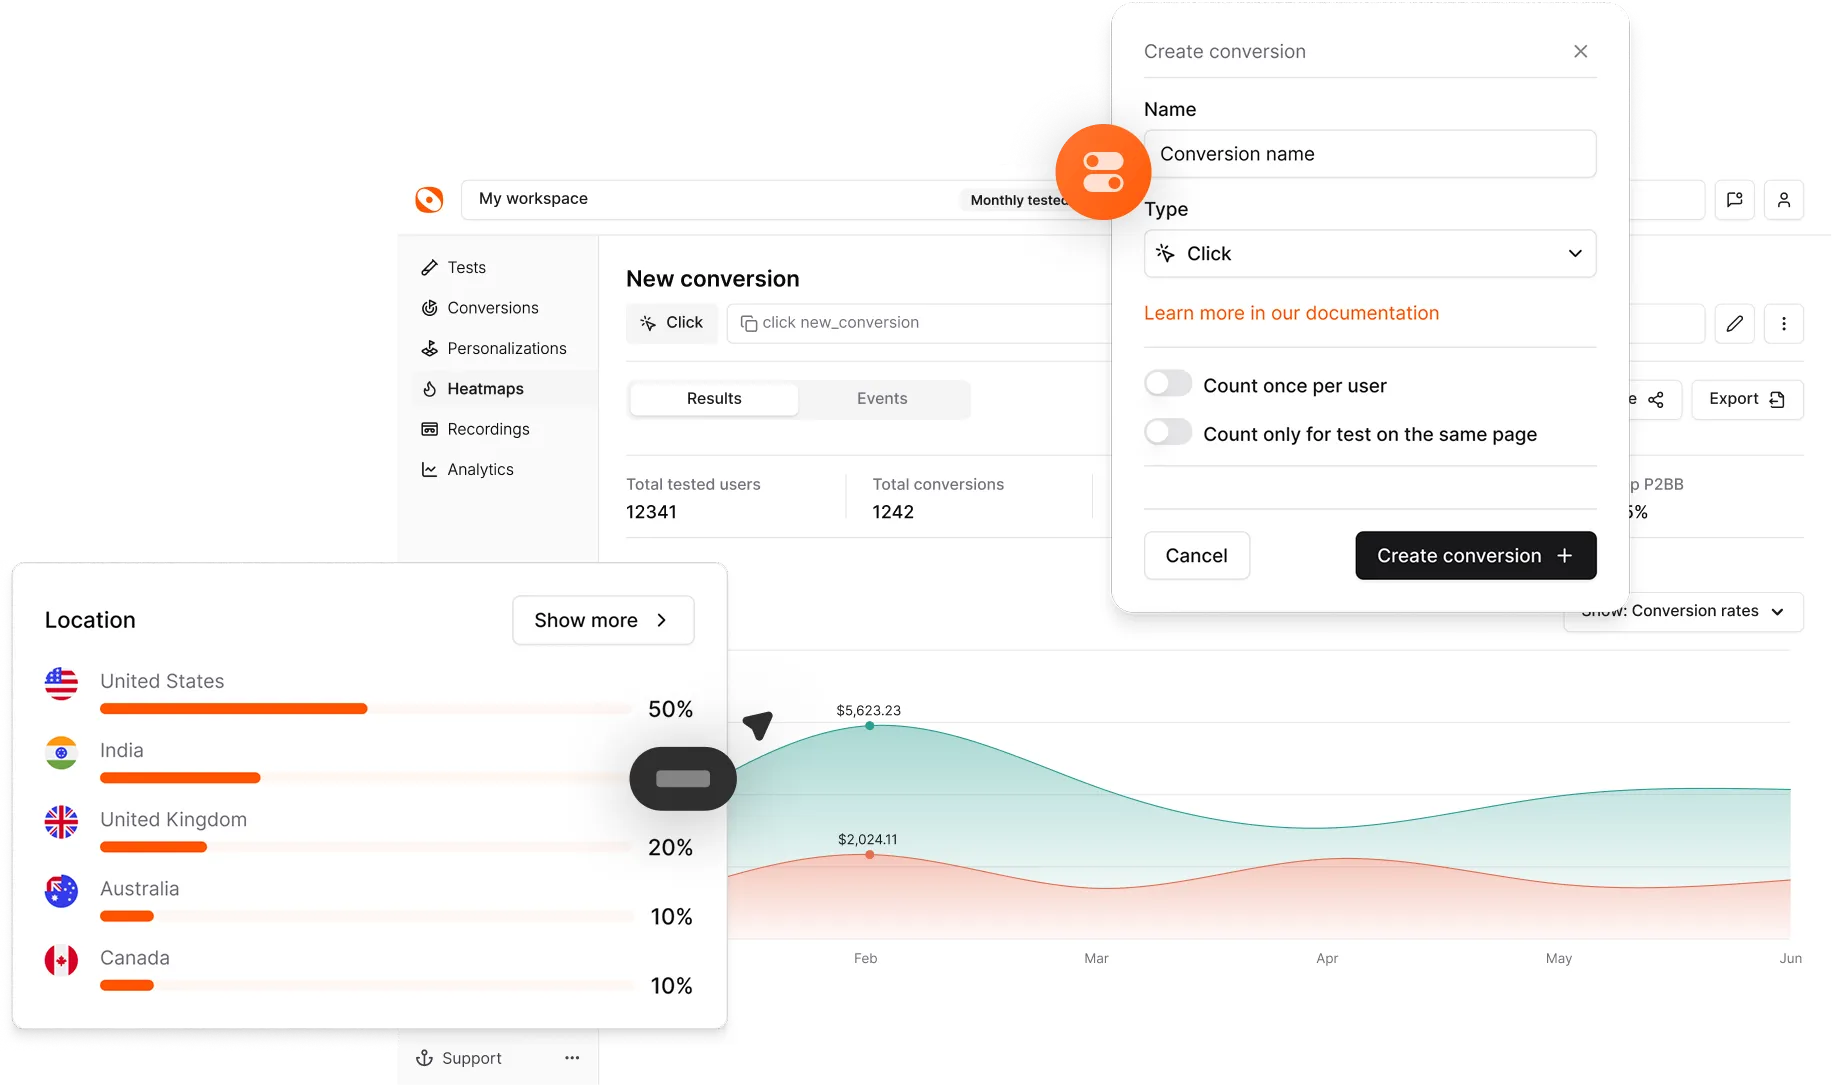
Optibase is the ultimate A/B testing app for Webflow. With a straightforward workflow — install the app, create a test, and analyze results — Optibase makes A/B testing in Webflow a cakewalk. Guesswork is not an option; from copy and design to web pages, this platform drives data-driven decisions and elevates your website’s performance.
With an expert support team and convenient performance tracking, you can be positive about having your A/B tests deliver real game-changing insights with Optibase.
What is statistical significance and why is it important in A/B testing?
A/B testing statistics determine if the differences between versions are relevant or merely a case of luck by chance. It validates the significance of test outcomes.
How to determine if my A/B test results are statistically significant?
Statistical significance can be detected with standard testing methods. They may include hypothesis testing and involve p-values or confidence intervals.
What is the difference between statistical and practical significance in A/B testing?
Statistical significance shows if the differences in A/B results are random or not. Practical significance shows the actual impact of real-world differences.