A/B testing might sound like a techy experiment best left to data scientists, but here’s the kicker: it’s one of the most user-friendly ways to optimize your website. Whether you’re designing in Webflow or managing a content-rich platform, understanding A/B testing statistics can take your game from guesswork to data-driven genius.

Before we dive headfirst into analytics, let’s get our jargon straight. When you’re running an A/B test, here are the metrics you should have on your radar:
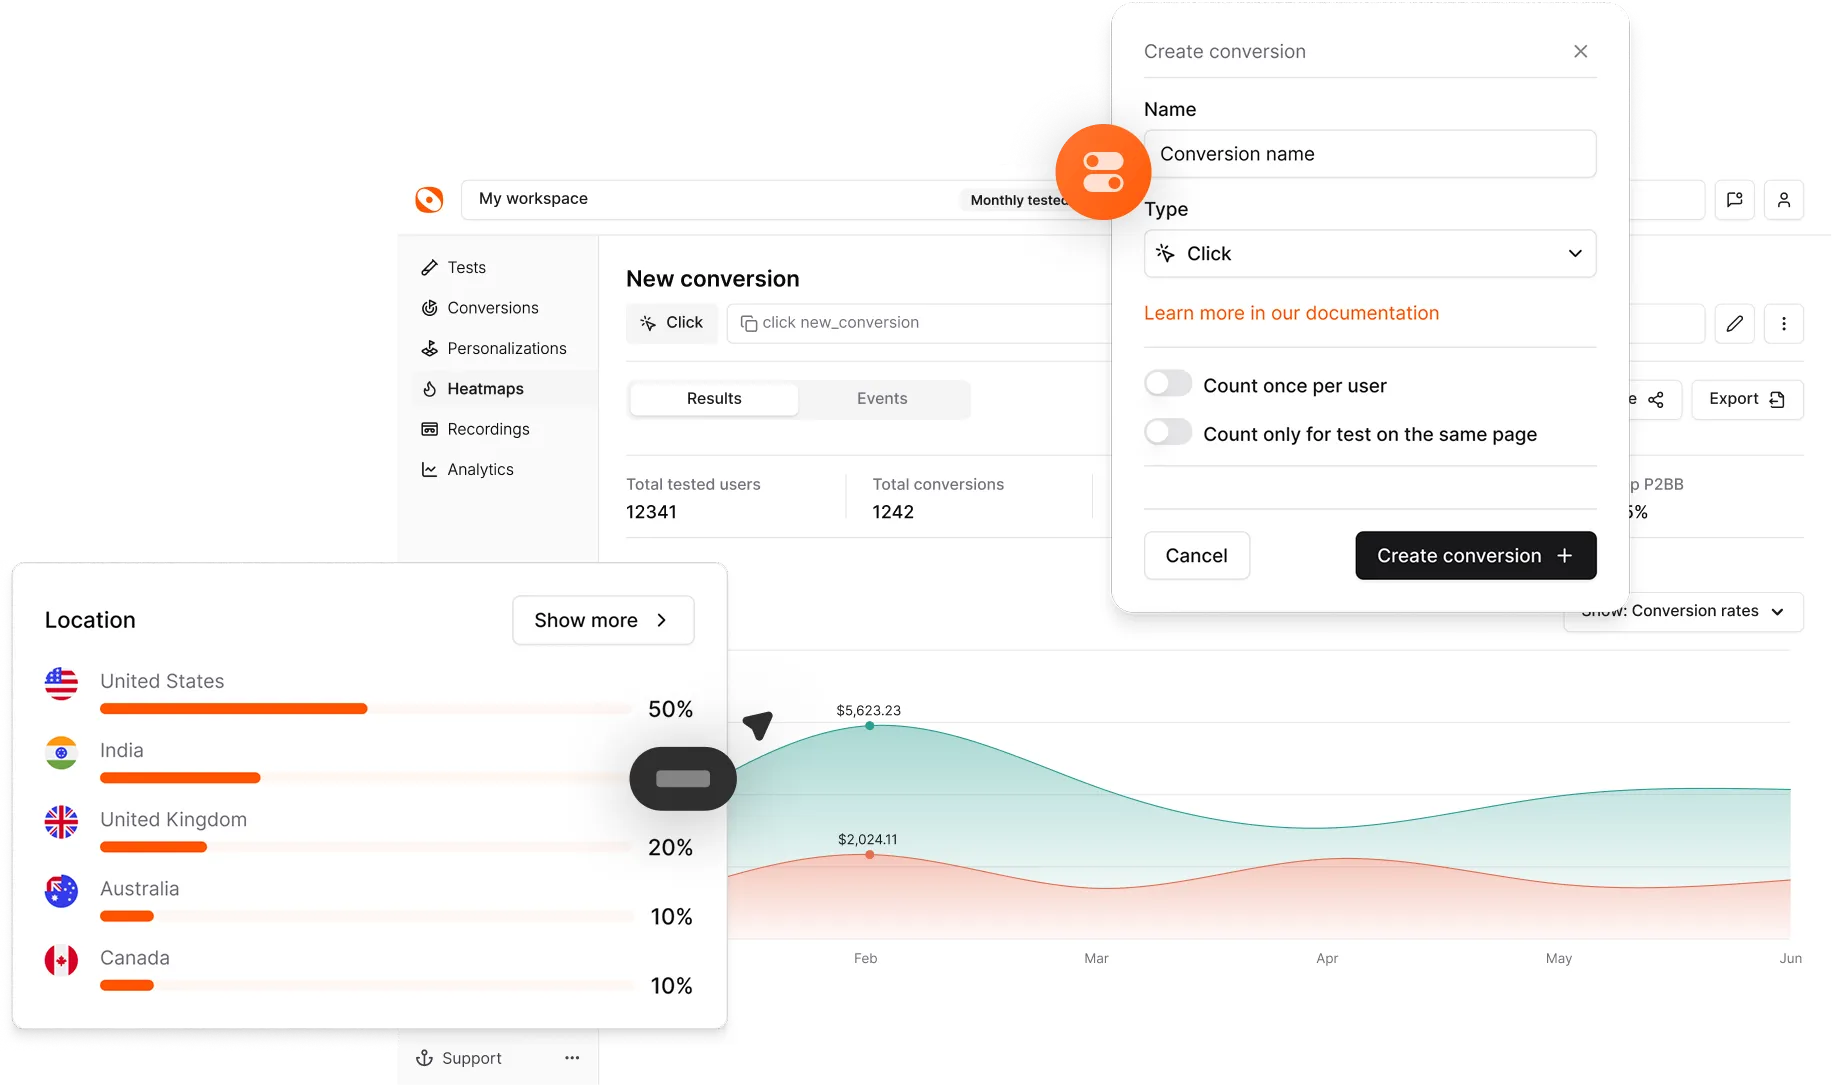
This one’s the MVP. It’s all about how many people completed the desired action on your site. Whether it’s signing up for a newsletter or clicking that shiny “Buy Now” button, this is your north star.
Did visitors take one look at your page and ghost you? Tracking bounce rates helps you figure out which version of your site keeps them sticking around.
If you’re testing button text or placement, CTR is your go-to hack. It’ll tell you how effective your changes are in getting users to engage.
Got long-form content? Time on Page is the go-to metric to see which version holds your audience’s attention longer.
If you’re monetizing, track the money. RPV helps you determine which version actually drives more revenue per user. Don’t drown in metrics! Pick the ones most relevant to your goal and stay laser-focused.
Now, let’s talk about the magic word: statistical significance. This is the science-y part of A/B testing, but it’s also the part that ensures your results aren’t just random flukes.
In plain English, this tells you whether your A/B testing results work. If you flip a coin 10 times and it lands heads 8 times, does that mean the coin’s broken? Not really. It could just be luck. This significance ensures your test results are driven by actual changes and not chance.
Tools like Optibase and Optimizely do it for you, so no need to whip out an A/B testing statistics textbook. Here are some of the things that you can do:
So, your test is complete, and you have data now. What happens now? Understanding the statistical results is where the rubber meets the road.
If Version A crushed it and Version B flopped, that’s great! But don’t just pop the champagne. Look deeper:
No clear winner? No problem. This is still valuable data. It tells you what doesn’t work, narrowing down options for your next test.
A/B testing is a continuous cycle. Use your findings to refine, test again, and keep optimizing.

When it comes to crunching numbers, the right tools make all the difference. Here are some options in the A/B testing statistics arena:
Perfect for in-depth analysis, Optimizely offers features like audience targeting and advanced reporting. It’s ideal for scaling startups looking for precision.
Want to pair A/B testing with heatmaps? Crazy Egg lets you see exactly where users click, scroll, and drop off.
If you’re into app optimization, SplitMetrics is a niche tool that focuses on A/B testing for app store pages.
A user-friendly platform with robust analytics, VWO simplifies test creation and result interpretation, making it perfect for growing businesses.
Most tools offer free trials, so test them out before committing.
A/B testing statistics are the information that every website needs and Optibase makes it effortless for Webflow users. From tracking metrics that matter to spotting what clicks with users, Optibase simplifies the process.
What’s more? Even “failed” tests offer your team new insights, pushing your site closer to perfection. No fluff, just results.
If you’re ready to make data-driven decisions and boost conversions, give Optibase a shot. Trust us, your Webflow game will thank you.
Why are A/B testing statistics important?
Statistics are the backbone of A/B testing as they help validate whether changes made to a webpage have a meaningful impact. Without statistical analysis, it’s impossible to know if an observed improvement is due to your tweaks or just random chance.
What is statistical significance in A/B testing?
Statistical significance measures how confident you can be that the results of your A/B test are not due to random variation. A statistically significant result indicates a higher probability of the observed difference being real and replicable.
How many visitors are required for reliable A/B testing statistics?
The number of visitors required depends on factors like your baseline conversion rate, expected improvement, and desired confidence level. Tools like sample size calculators can help determine this number, but generally, more traffic leads to more reliable results.